Features
Data collection
Multiple platform data collection
Prism collects data including the usage of websites, streaming players and applications.
JavaScript and non-JavaScript solutions, streaming player solutions, SDKs for iOS and Android apps are available. Gemius is supporting customers in gathering data on non-typical platforms.
Easy cross-domain measurement
Multiple websites or groups of websites can be easily measured without problems concerning visitor duplication thanks to the use of 3rd party visitor tracking.
Accurate visitor tracking
Deletion of cookies is a big problem that Internet reseach companies are facing. Thanks to Gemius’ pioneering solution, browsing ID, the study ensures a lower amount of deleted visitor IDs. In result Gemius presents more accurate data than the one offered by standard cookie mechanisms.
Streaming and eCommerce data collection standard
Prism comes with libraries that make the measurement of audio, video and online commerce easier, standarized and efficient.
Enterprise performance
Gemius infrastructure collects data from multiple markets and top online players. We set no limits to the amount of data a customer wants to collect.
Data safety
The data of Gemius clients is collected and stored within a secured and fail-safe infrastructure.
Raw data access
Gemius offers the clients a possibility to access raw data that is collected for Prism.
gemiusTraffic data sharing
All historical data collected for the gemiusTraffic or gemiusAudience research can be imported to Prism. Prism can work with the existing Traffic scripting.
This feature is available in the Monitoring and the Enterprise packages.

Reporting
Flexibility
Thanks to the use of an advanced sampling mechanism Prism allows the delivery of instant and highly flexible reports. Sampling allows to quickly generate reports for large sets of data.
The mentioned mechanism is designed for Gemius clients to get an estimated but very adequate value of the current metrics which have low statistical deviation.
Default report set
Gemius delivers an extensive set of pre-configured reports for typical applications.
Custom reports
Users can define their own reports with custom data segmentation and metric sets. Prism will also include results for historical data in a newly created report.
Monitoring
The monitoring feature delivers constantly updated reports with results calculated based on full-data, regardless of the data size.
This feature works with selected metrics and data segmentations.
It is available in the Monitoring and the Enterprise packages.
Full-data based results
The user can select any sample-based report and additionally order full-data results including any data range.
This feature is available in the Enterprise package.
Flexible reporting periods
Prism calculates reports that include daily results for customized time periods . The period can be segmented by hours, days, weeks or months. It can also be easily filtered to extract data for selected days of the week.
All results from multiple periods can be compared in a single view.
Reporting period length in Open and Monitoring packages cannot exceed 184 days.
Calendar events
Events that impact the visitors behavior (like the start of a TV campaign) can be marked on the project timeline and displayed in reports for context information.
Data segmentation
Advanced traffic segmentation
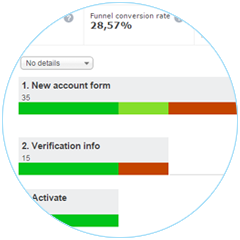
All collected data can be filtered and segmented with any of the multiple dimensions available in Prism. It is available to filter by parameters of URLs, referring URLs or custom parameters passed with the data by the customer. Segments can be crossed and drilled down. There are three levels of data filtering (single events, visits, visitors) and additional funnel segmentation available in the interface.
Traffic sources
Thanks to data segmentation by traffic sources the clients can compare the performance of acquiring visitors from a variety of sources - search engines, social media, affiliates and campaigns. Prism allows to compare how visitors perform in each segment.
Different traffic sources, like search engines or social sites, can be further drilled to the name of the source, domain or exact referring URLs.
Campaigns
Track how different campaigns (Adwords, display, newsletters, etc.) are affecting KPIs of your digital product. Prism supports the universal UTM parameters standard for campaign traffic recognition.
Visitor activity
Prism can segment data by visited URLs, referring URLs, frequency of contacts, days of the week and hours of the day to deliver information on features and content performance, especially in connection with traffic sources and campaigns segmentation.
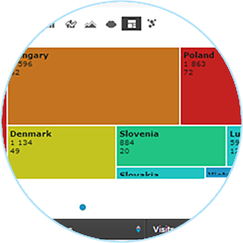
Visitor location
Users can divide visitors into segments defined by continent, country, region and city.
Visitor device
Prism shows the type of device that each visitor is using (mobile phone, PC, smart TV, etc.) including the brand and model. Available for developer's purposes are numerous technical specifications of devices like browsers, operating systems, screen resolutions, cookie acceptance and others.
Custom parameters
Data collected for analysis with Prism can be freely labelled with custom parameters and values. The system can read custom parameters passed within the tracking code, in the page URL or the referring URL. Custom parametrization is the core of advanced use of all analytical capabilities of Prism.

Metrics
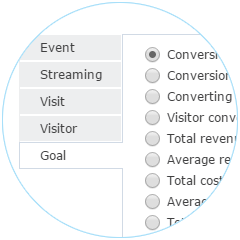
Extensive metric set
Prism reports can employ an extensive set of metrics ranging from the measurement of content consumption, time spent, reach, points of entry and exit, bouncing, engagement to the measurement of conversion, revenue, cost and ROI.
Metric modifiers
Metric modifiers allow reports to show not only the absolute value of the metric but also its relation to a bigger segment of data (or all data) and to track changes of metric values compared to previous reporting period.
Results delivery
Personal dashboards
Every user has an own, customizable dashboard for each project.
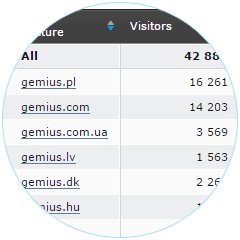
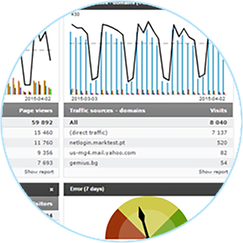
Textual and graphical data presentation
The data is presented in a user-friendly graphical and tabular format. The are available multiple configurations of tabular views and chart formats (timeline, bars, cloud, map, tree map, top segments, area, pie-chart, tachometer, deviation).
Export in multiple common data formats
Prism supports the export of results XLS, CSV, PDF and PNG file formats.
Scheduled analytics reports mailings
All Prism users can set up daily, weekly, monthly or quarterly emails with reports generated in XLS, CSV, PDF or PNG file formats.
Access management
Data access rights
Each user can access a defined set of projects. Each Prism project contains data visible only for the user who has rights to access it. A project can contain a subset of data from a different projects. In this way teams in large organizations can work on their own data and the whole picture can be seen in a project that contains all organization data.
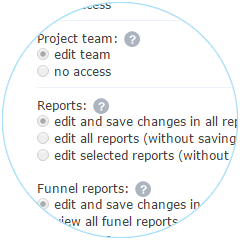
Feature access rights
Users can have different access rights to functional parts of the system within one pool of data (reporting, segmentation, configuration, access management).